Callisto- CPM for the masses - Reporting |

|
Corporate Performance Management
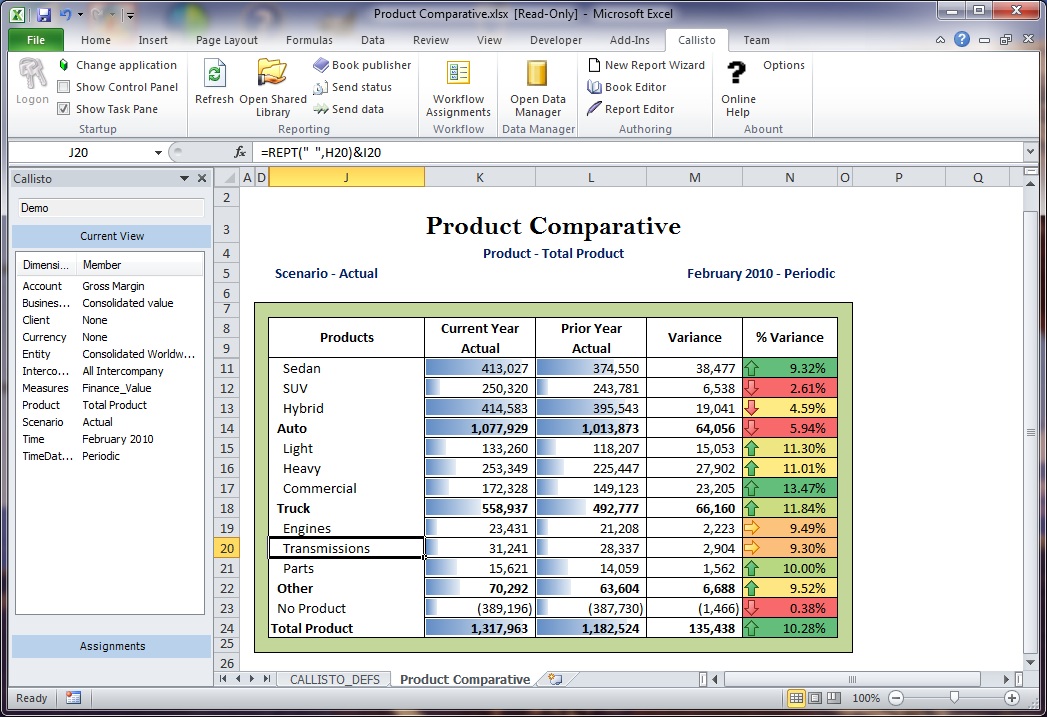 ReportingCreate those beautiful reports everyone expects today, and do it with direct live access to your data. Callisto allows users to maximize the Excel experience by preserving the power of Excel they depend on and love. Retrieve live data into these reports then combine that live data with the Excel calculations that enable your users to manipulate data providing information not stored in your database, like variance and percentage variances. Combine this with the native formatting available in Excel to produce powerful reports like the one shown on the right. |
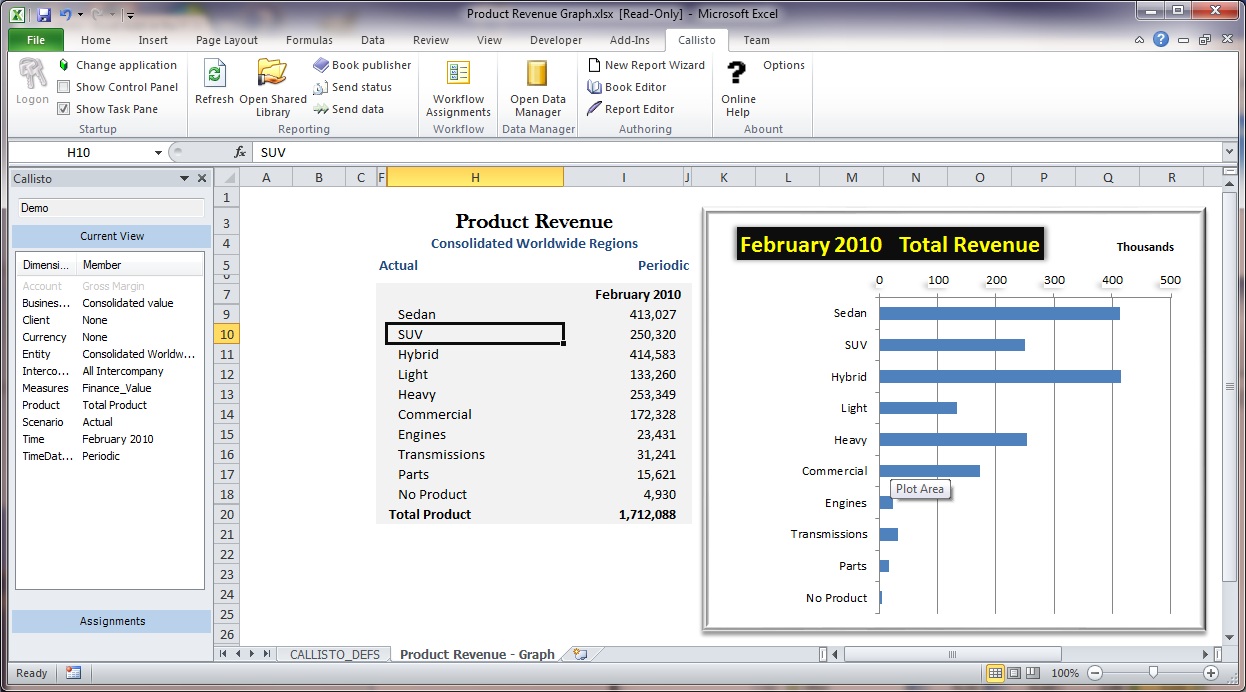 Charts and Graphs- Callisto reports support all the Excel charts and graphs. When combined with the dynamic expansions of Callisto it is easy to create graphs that automatically change to reflect changes in the structure of the Callisto application without any maintenance to the Excel workbooks. Just refresh the reports, and they automatically show exactly what is in database. In the report to the right, when new products are added, they automatically appear in the report and the chart. |
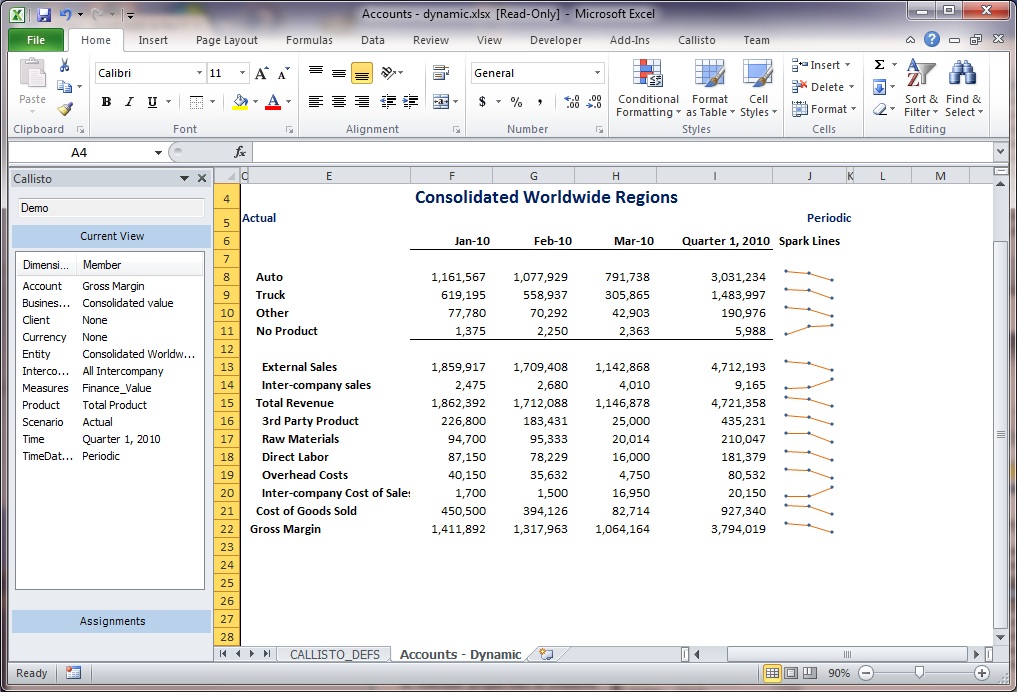 Trend Reports- The rows or columns of your Callisto reports can be easily defined to show any combination of dimensions and members desired. The members that are returned in your report can be defined by using a fixed list of members, or even a dynamic list of members derived by custom logic. The report to the right shows the quarters of the year, but with just a few clicks any level of the Time dimension could be displayed in their place. Our Trend Report example contains a dynamically returned breakout of members from the Product dimension in the top rows, followed by a fixed set of our Income Accounts giving us a Product Income Trend Statement. This is just one example of the powerful Trend Reports all of your users will be able to create using Callisto. |
 Preserves all Excel functionality- Callisto reports provide unmatched flexibility by allowing users to manipulate any Callisto report without having to worry about disrupting the reports interaction with the Application Data. Within the Callisto reports users can insert rows and columns any place desired, define Excel calculations in any location, as well as format cells and ranges just the way you want using all the Excel functionality. The native Excel functionality is always preserved by Callisto and can be used to interact with your data, members, or member properties in creative ways only you can imagine. Callisto adds any changes to the report definition as you edit the report and is therefore able to preserve these changes in your live Callisto Reports. |
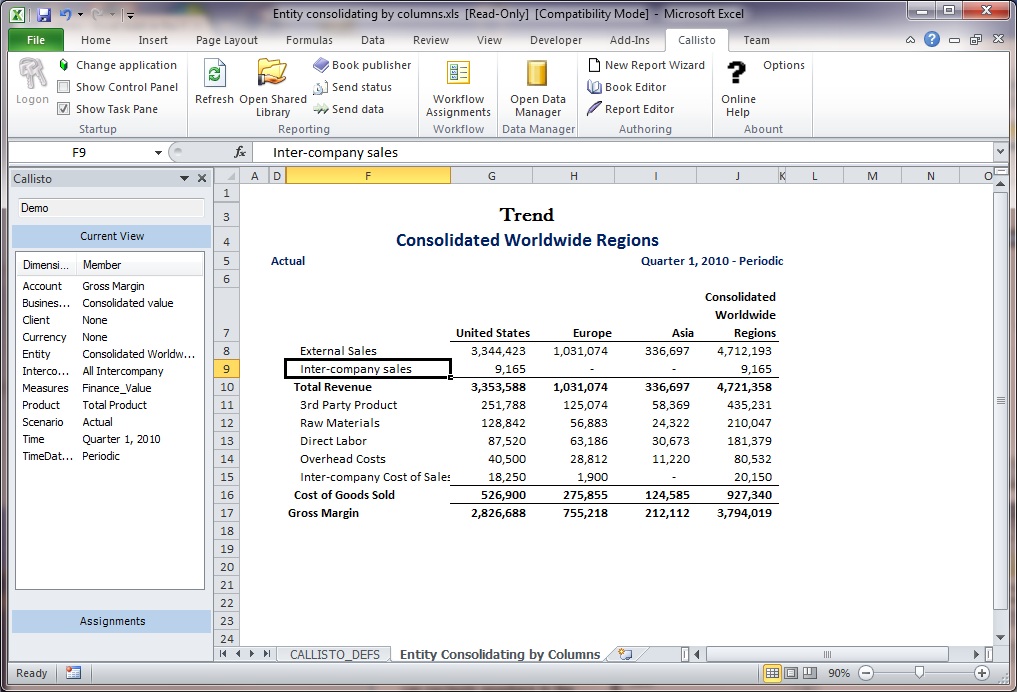 Consolidating Reports- Place any dimensions on columns or rows. In this example, the Entity dimension is on columns with a dynamic expansion interacting with the Control Panel, so the user can navigate anywhere in the database and see a Consolidating Income Statement for the Entity, Time Period, Scenario, and Product currently selected. The same functionality makes it easy to see things such as Product Revenue by Entity, where the Products expand across the columns and the Entities expand down the rows, etc. |
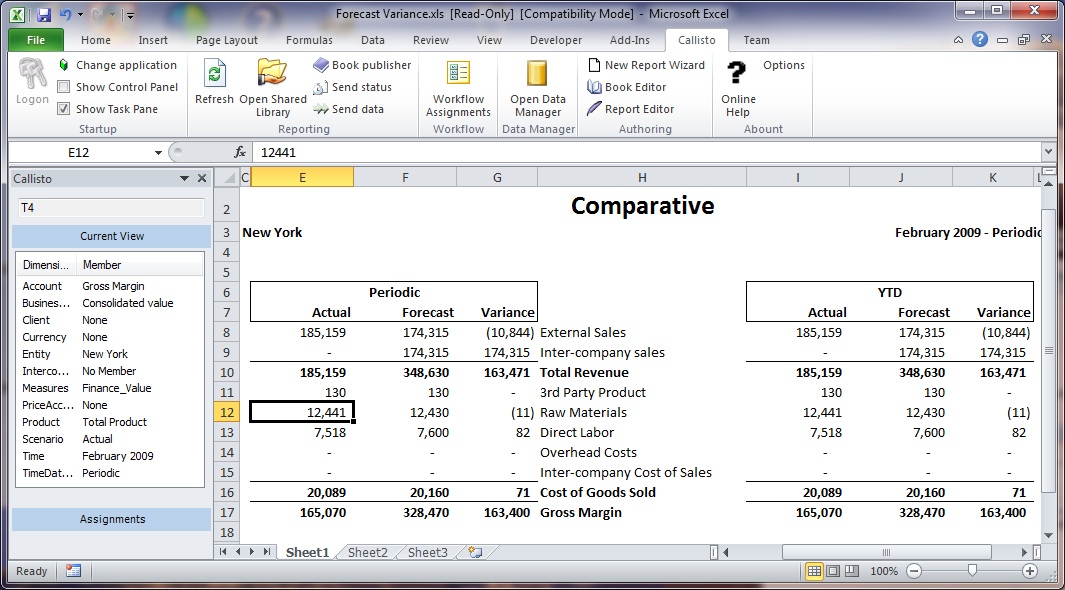 Variance Reporting- Side by side comparatives with descriptions in the middle are easy with Callisto. Put descriptions or any other properties any place desired. |
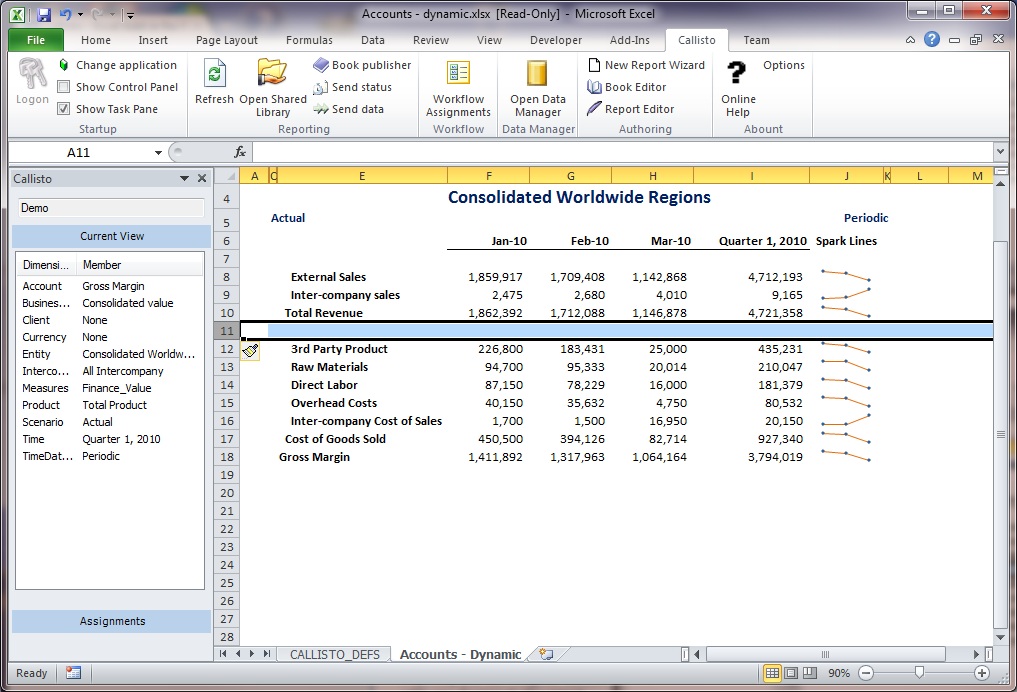
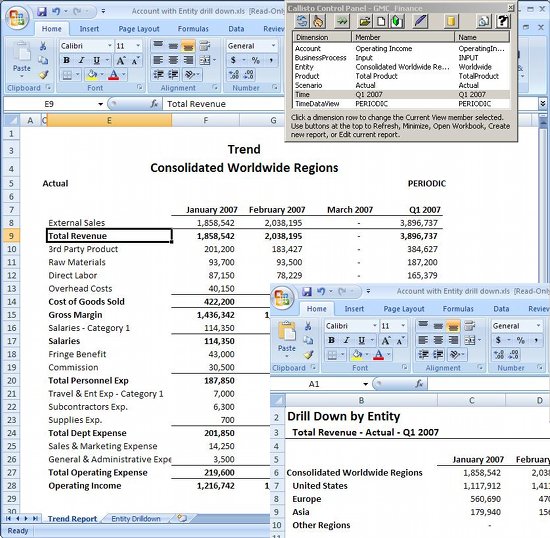 Guided Investigations- Create reports where a simple double click can be used to navigate to any alternate view of the data. This allows you to include Guided Investigation paths that make sense for your data as your users navigate through your multidimensional model. Users will no longer need to be confused by drilling down many meaningless hierarchy paths trying to find the path that actually means something.In the example on the right, when the user double clicks on "Total Revenue", Callisto navigates to the report showing a break out of revenue by Entity. And your drills are not limited to Excel. You can include drills to web systems such as Reporting Services reports, or Sharepoint sites, to allow users to continue their investigations to any level of detail you want to provide in your company. |
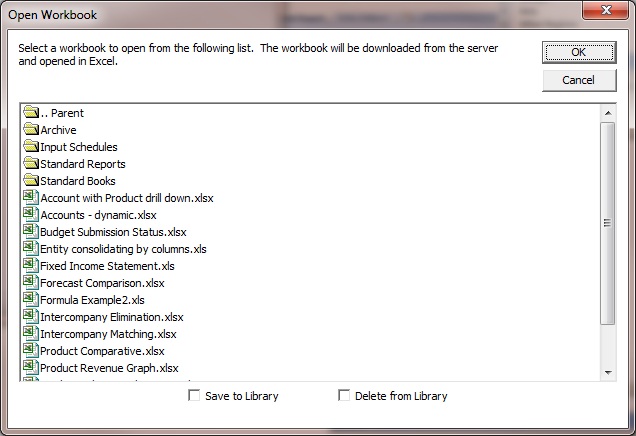 Shared Library of Reports- Reports can be organized into a shared library which all users can access. Administrators will be able to create a common library of standard reports that insure only one official view of data exists. The standard reports in the shared library can be used as they are or as templates for users to create custom reports of their own from. Reports you want to insure are only used as they are can be protected against changes by others. |
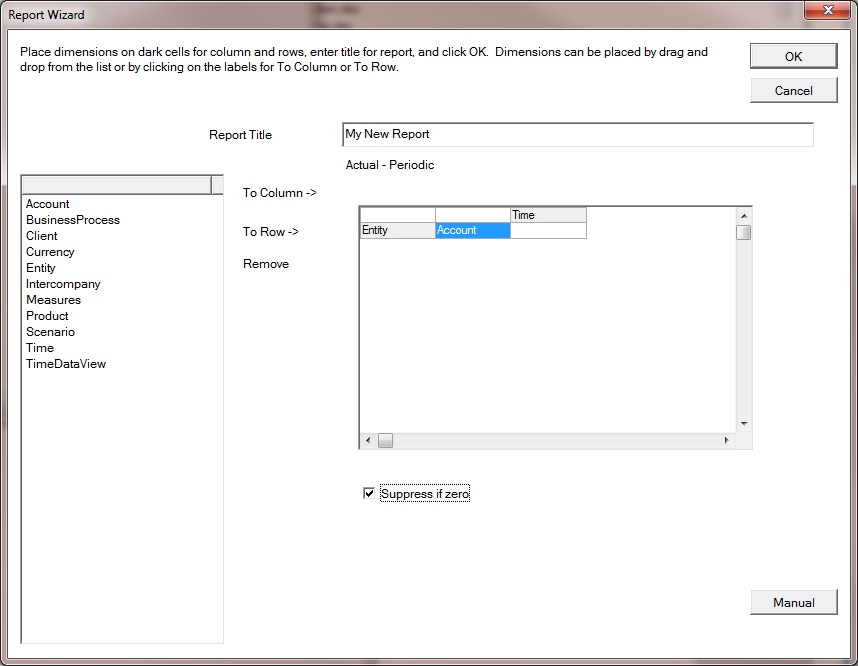
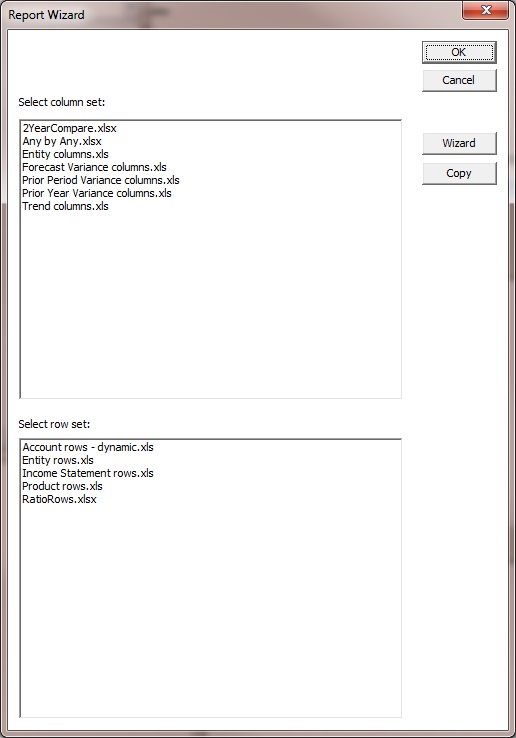 Report Wizard- The Callisto Report Wizard contains several column and row templates in a list that can be mixed and matched in any combination to create new reports in a flash. Create your own library to provide a rich set of templates tailored exactly the way you want for your application.And if a user does not find a template for what they want, with the Wizard they can use a simple drag and drop interface to create a new report from scratch. |
 |